Charles Darwin lamented that his transformative theory of evolution would not be accepted quickly by the scientific community. General acceptance, he saw, would have to wait until his friends and colleagues — captives of their prior work, stature, and success as traditional biologists — had been replaced by others not dependent on sustaining the status quo. Similarly, most active “performance” investment managers today are so attached to their work, stature, and success that many do not yet recognize a seismic change in their profession. The dynamics that produced the rise of active investing to prominence also carried the seeds of its inevitable peaking, to be followed by an increasingly recognizable decline — first in the benefits accruing to clients and then in benefits to practitioners.
As we all know—but without always understanding the ominous long-term consequences—over the past 50 years, increasing numbers of highly talented young investment professionals have entered the competition for a faster and more accurate discovery of pricing errors, the key to achieving the holy grail of superior performance. They have more-advanced training than their predecessors, better analytical tools, and faster access to more information. Thus, the skill and effectiveness of active managers as a group have risen continuously for more than half a century, producing an increasingly expert and successful (or “efficient”) price discovery market mechanism. Because all have ready access to almost all the same information, the probabilities continue to rise that any mispricing — particularly for the 300 large-capitalization stocks that necessarily dominate major managers’ portfolios — will be quickly discovered and swiftly arbitraged away into insignificance. The unsurprising result of the global commoditization of insight and information and of all the competition: The increasing efficiency of modern stock markets makes it harder to match them and much harder to beat them — particularly after covering costs and fees.
Fifty years ago, beating the market (i.e., beating the competition: part-time amateurs and overstructured, conservative institutions) was not just possible — it was probable for hardworking, wellinformed, boldly active professionals. Institutions did less than 10% of total NYSE trading, and individuals did more than 90%. Those individual investors not only were amateurs without access to institutional research but also made their decisions — fewer than one a year — primarily for such outside-the-market reasons as an inheritance or bonus received, a down payment on a home, or college tuition to pay. Today, the statistics are upended. More than 95% of trades in listed stocks, and nearly 100% of other security transactions, are executed by full-time professionals who are constantly comparison-shopping inside the market for any competitive advantage. Armed with research and a continuous flood of global market information, economic analyses, industry studies, risk metrics, company reports, and superb analytical models, all investment professionals now have access to more market information than they can possibly use. And with Regulation Fair Disclosure (Reg FD), the US SEC insists that all information be disclosed to all investors at the same time.1 Each of the many individual changes has been important. The compounding change of all the many changing factors over the past 50 years has been astounding.
Although clients put up all the capital and accept all the market risks, the sought-after “performance” for clients — incremental returns above the market index — has been faltering. Meanwhile, active investing has become one of the most financially rewarding service businesses for investment managers in history.
To be sure, the degradation of performance investing is not a light switch but, rather, a rheostat. Even now, a few specialist managers appear to have found creative ways to exploit the very market forces that confound most large active managers. However, such managers are small in capacity, hard to identify in advance, and limited in how much they will accept from any one client or even closed to new accounts, and so they cannot accommodate more than a modest fraction of potential institutional demand.2 Meanwhile, most large investment managers are obliged by their size to invest primarily in the 300 stocks most widely owned and closely covered by experienced portfolio managers and expert analysts.
A Brief History of Performance Investing
The key to understanding the profound forces for change in active investing — particularly in the results produced for investors — is to study major trends over the long term.3 Fifty years ago, as performance investing was getting started, insurance companies and bank trust departments dominated institutional investing. They were deliberately conservative and hierarchical, controlled by investment committees of senior “prudent men” — still haunted by the Great Depression, World War II, the Korean War, and the Cold War — who were understandably risk averse. Meeting for a few hours once or twice a month, these worthies promulgated an “approved list” from which junior trust officers cautiously assembled buy-and-hold equity portfolios dominated by utilities and blue-chip industrials — U.S. Steel, General Motors, DuPont, and possibly Procter & Gamble — plus a few seasoned growth stocks, such as Coca-Cola and IBM. Dividends were sought, taxes avoided, and highgrade bonds purchased in laddered maturities. Trading was considered “speculative.”4
But change was coming. As Fidelity and other mutual fund managers achieved superior rates of return, or performance, mutual fund sales boomed. Pension funds noticed and wanted in on the winning.
Corporate pension assets, initially accepted by major banks as a “customer accommodation,” were accumulating rapidly. Money center banks soon became enormous investment managers and, with fixed-rate commissions surging, major consumers of brokers’ research and Wall Street’s emerging capabilities in block trading. New investment firms were organized to compete for the burgeoning pension business — some as subsidiaries of mutual fund organizations but most as independent firms. Their main proposition: active management by the most talented young analysts and portfolio managers, who would be first to find and act on investment opportunities and would meet or beat the results of the so-called performance mutual funds. Better yet, the portfolio managers would work directly with each client.
Early practitioners of performance investing experienced significant impediments and costs that would be strange to today’s participants. Block trading was just beginning and daily NYSE trading volume was only one-third of 1% of today’s volume; thus, trades of 10,000 shares could take hours to execute. Brokerage commissions were fixed at an average of more than 40 cents a share. In-depth research from new firms on Wall Street had barely begun. Computers were confined to the “cage” or back office.
Although overcoming these difficulties was not easy, for those who knew how, the results were grand. Aspirations of investors shifted from preservation of capital to performance — that is, beating the market. A.G. Becker and Merrill Lynch created a new service that measured, for the first time, each pension fund’s investment performance against that of competitors and showed that the banks’ investment performance was often disappointing compared with that of the new firms. A new kind of corporate middle management role emerged: the internal manager of external investment managers of pension funds. Supervising a large pension fund’s 10, 20, or even 30 investment managers, meeting each year with another 25–50 firms hoping to be chosen, and then selecting the “best of breed” — all required the expertise of fulltime specialists, often aided by external investment consultants. The rapidly accumulating pension funds began pouring their money out of the banks and into the new investment firms that promised superior performance.
With dozens of selection consultants scouring the nation to find promising new investment managers for their large clients, getting business came easier and faster for promising new investment firms.5 Increasing numbers of energetic investment managers formed new firms — or new pension divisions in established mutual fund organizations — to pursue the pension funds’ demand for superior performance. Adding insult to injury, the new investment firms were often populated with the banks’ “best and brightest,” fleeing from trust department procedures they found stultifying and financially unrewarding.
The opportunities for superior price discovery were so good in the 1970s and 1980s that the leading active managers were able to attract substantial assets and — not always, but often — deliver superior performance. But as the collective search for mispricing opportunities attracted more and more skillful competitors — aided by a surging increase in Bloomberg machines, e-mail, algorithms, and other extraordinary new data-gathering and dataprocessing tools — price discovery got increasingly swift and effective.
With all these changes, the core question is not whether the markets are perfectly efficient but, rather, whether they are sufficiently efficient that active managers, after fees, are unlikely to be able to keep up with, and very unlikely to get ahead of, the price discovery consensus of the experts. In other words, after 50 years of compounding changes in investment management and in the security markets and given the difficulty of successful manager selection and the poor prospects for truly superior long-term returns, do clients have sufficient reason to accept all the risks and uncertainties — and fees — of active management?
A Brief History of Fees
The pricing of investment management services has had an interesting history and a single direction — up. Before the 1930s, conventional fees were charged as a percentage of the investment income received in dividends and interest. During the 1930s, Scudder, Stevens & Clark shifted the base for fee calculation to a 50-50 split — half based on income and half based on assets. Still, the level of fees was low. In those days, investment counseling might have been a fine profession, but it was certainly not a great business. Those going into investment management typically hoped to cover their costs of operation with client fees and then make some decent money by investing their own family fortunes. Bank trust departments, often restricted to very low fees by state legislatures seeking to protect widows and orphans, traditionally charged little or nothing. Fees of only 0.1% of assets were common.6
With the formation of new investment firms in the 1960s, the terms of competition changed in ways that surprised the banks and insurers. With their long experience in such institutional financial services as bank loans, cash management, and commercial insurance, they knew to expect tough price competition and aggressive bargaining by major corporate customers and they knew how to compete on the basis of costs.
But in the new era of performance investing, pension management had been converted from a cost-driven market into a value-driven market, with value determined primarily by expectations of superior future investment performance. (Superior investment returns could reduce annual contributions and thus lift reported earnings by reducing the annual cost of funding pensions.) The new managers found that they could easily charge much more than banks and insurance companies charged because higher fees were seen as a confirmation of the expected superior performance. Compared with the magnitude of the predicted superior performance, the fees for active investment simply did not seem to matter; any quibbling about fees was dismissed with such comments as, “You wouldn’t choose your child’s brain surgeon on the basis of price, would you?”
Decade after decade, assets of mutual funds and pension funds multiplied, and at the same time, fee schedules for active investment management tripled or quadrupled — instead of going down, as might be expected. With this combination, the investment business grew increasingly profitable. High pay and interesting work attracted increasing numbers of highly capable MBAs and PhDs, who became analysts and portfolio managers and, collectively, more competition for each other. Meanwhile, particularly during the high returns of the great bull market of the last quarter of the 20th century, investors continued to ignore fees because almost everyone assumed that fees were unimportant.7
Fees for investment management are remarkable in a significant way: Nobody actually pays the fees by writing a check for an explicit amount. Instead, fees are quietly and automatically deducted by the investment managers and, by custom, are stated not in dollars but as a percentage of assets.8 Seen correctly — incremental fees compared with incremental results — fees have become surprisingly important. This view can best be seen by contrasting conventional perceptions with reality.
Fees for equity management are typically described with one four-letter word and a single number. The four-letter word is only, as in “only 1%” for mutual funds or “only half of 1%” for institutions.9 If you accept the 1%, you will easily accept the “only.” But is that not a self-deception?10 “Only 1%” is the ratio of fees to assets, but the investor already has the assets, and so active investment managers must be offering to deliver something else: returns. If annual future equity returns are, as the consensus expectation now holds, 7%–8%, then for what is being delivered to investors, 1% of assets quickly balloons to nearly 12%–15% of returns. But that is not the end of it.
A rigorous definition of costs for active management would begin by recognizing the wide availability of a market-matching “commodity” alternative: low-fee indexing. Because indexing consistently delivers the market return at no more than the market level of risk, the informed realist’s definition of the fee for active management is the incremental fee as a percentage of incremental returns after adjusting for risk. That fee is high — very high. If a mutual fund charging 1.25% of assets also charged a 12b-1 fee of 0.25% and produced a net return of 0.5% above the benchmark index each year — an eye-popping performance — the true fee would be very nearly 75% of the incremental return before fees! Because a majority of active managers now underperform the market, their incremental fees are over 100% of long-term incremental, risk-adjusted returns. This grim reality has largely gone unnoticed by clients — so far. But “not yet caught” is certainly not the strong, protective moat that Warren Buffett wants around every business.
The Investor’s Challenge
The challenge that clients accept when selecting an active manager is not to find talented, hardworking, highly disciplined investment managers. That would be easy. The challenge is to select a manager sufficiently more hardworking, more highly disciplined, and more creative than the other managers — managers that equally aspirational investors have already chosen — and more by at least enough to cover the manager’s fees and compensate for risks taken.
As the skills of competitors converge, luck becomes increasingly important in determining the increasingly meaningless performance rankings of investment managers.11 Although firms continue to advertise performance rankings and investors continue to rely on them when selecting managers, rankings have virtually zero predictive power. As price discovery has become increasingly effective, and thus security markets have become increasingly efficient, any deviations from equilibrium prices — based on experts’ consensus expectations of returns, which are based on analyzing all accessible information — have become merely unpredictable, random noise. Investment professionals know that any long-term performance record must be interpreted with great care. Behind every long-term record are many, many changes in important factors: Markets change, portfolio managers change, assets managed by a firm change, managers age, their incomes and interests change, whole organizations change. The fundamentals of the companies whose securities we invest in also change. Forecasting the future of any variable is difficult, forecasting the interacting futures of many changing variables is more difficult, and estimating how other expert investors will interpret such complex changes is extraordinarily difficult.
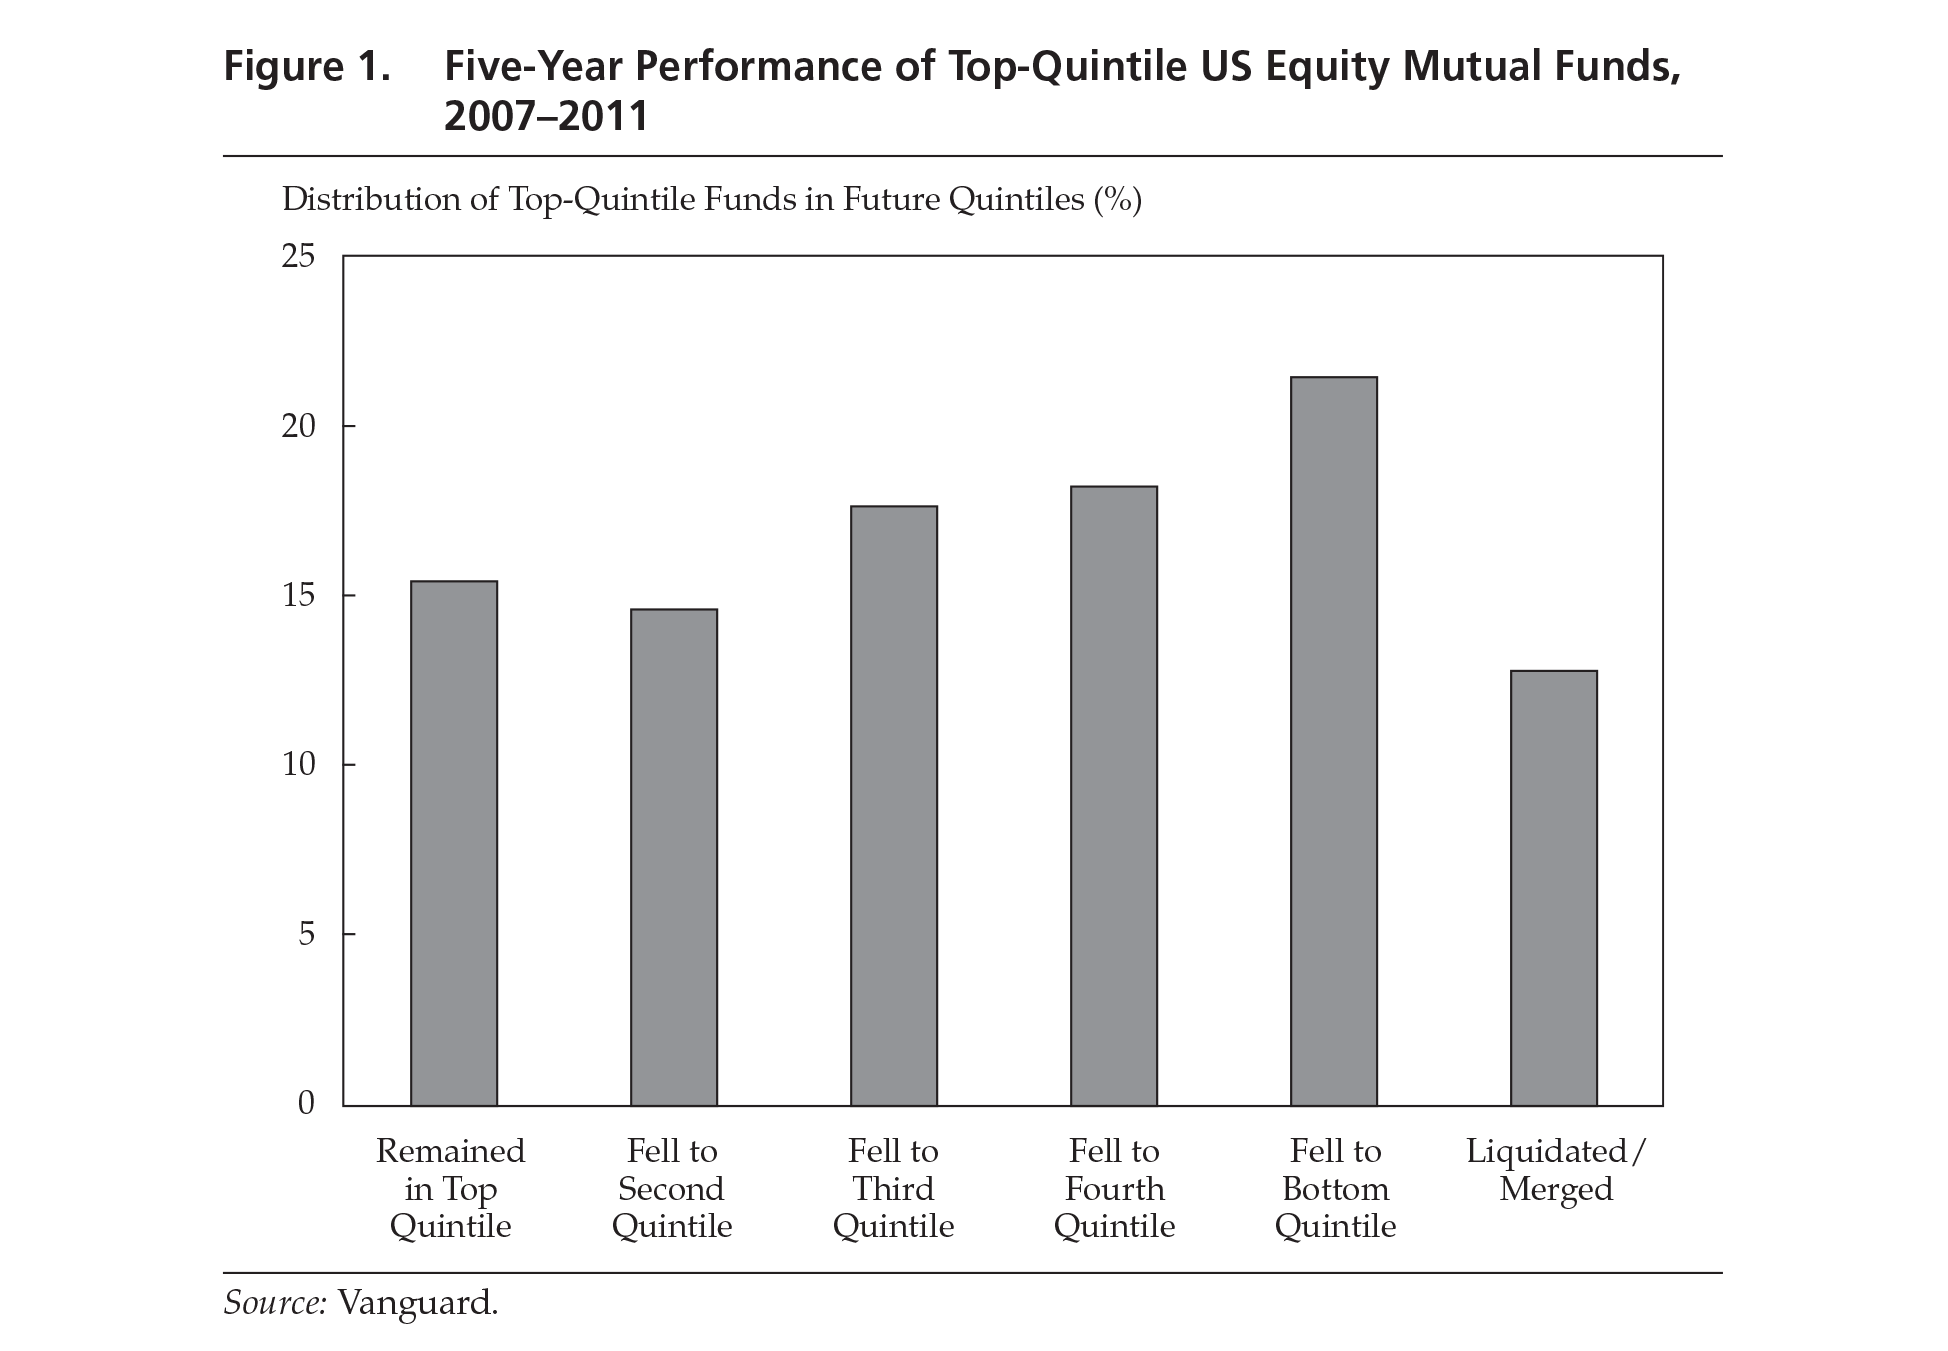
In a very efficient market, active investment managers’ results relative to market results would be random. A recent Vanguard report examined mutual fund performance over time and, with one exception, found no significant pattern. It concluded:
Results do not appear to be significantly different from random aside from the bottom quintile. …To analyze consistency, Vanguard ranked all U.S. equity funds in terms of risk-adjusted return for the five years ended 2006. We then selected the top 20% of funds and tracked their riskadjusted returns over the next five years (through December 31, 2011) to see how consistently they performed. If those top funds displayed consistently superior riskadjusted returns, we would expect a significant majority to remain in the top 20%. A random outcome, however, would result in approximately 17% of returns dispersed evenly across the six categories.12
The results, shown in Figure 1, are disconcertingly close to perfectly random.
A Clear Alternative
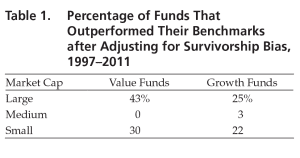
For many years, the persistent drumbeat of underperformance by active managers was endured because there were no clear alternatives to trying harder and hoping for the best. Often blinded by optimism, clients continued to see the fault as somehow theirs and so gamely continued to try to find Mr. Right Manager, presumably believing there were no valid alternatives. Now, with the proliferation of low-cost index funds and exchange-traded funds (ETFs) as plain “commodity” products, there are proven alternatives to active investing. And active managers continue to fail to outperform.13 Table 1 shows the grim reality of how few funds have outperformed their indices after adjusting for survivorship bias over the 15 years to year-end 2011.
After a slow beginning, some clients are increasingly recognizing that reality and taking action.
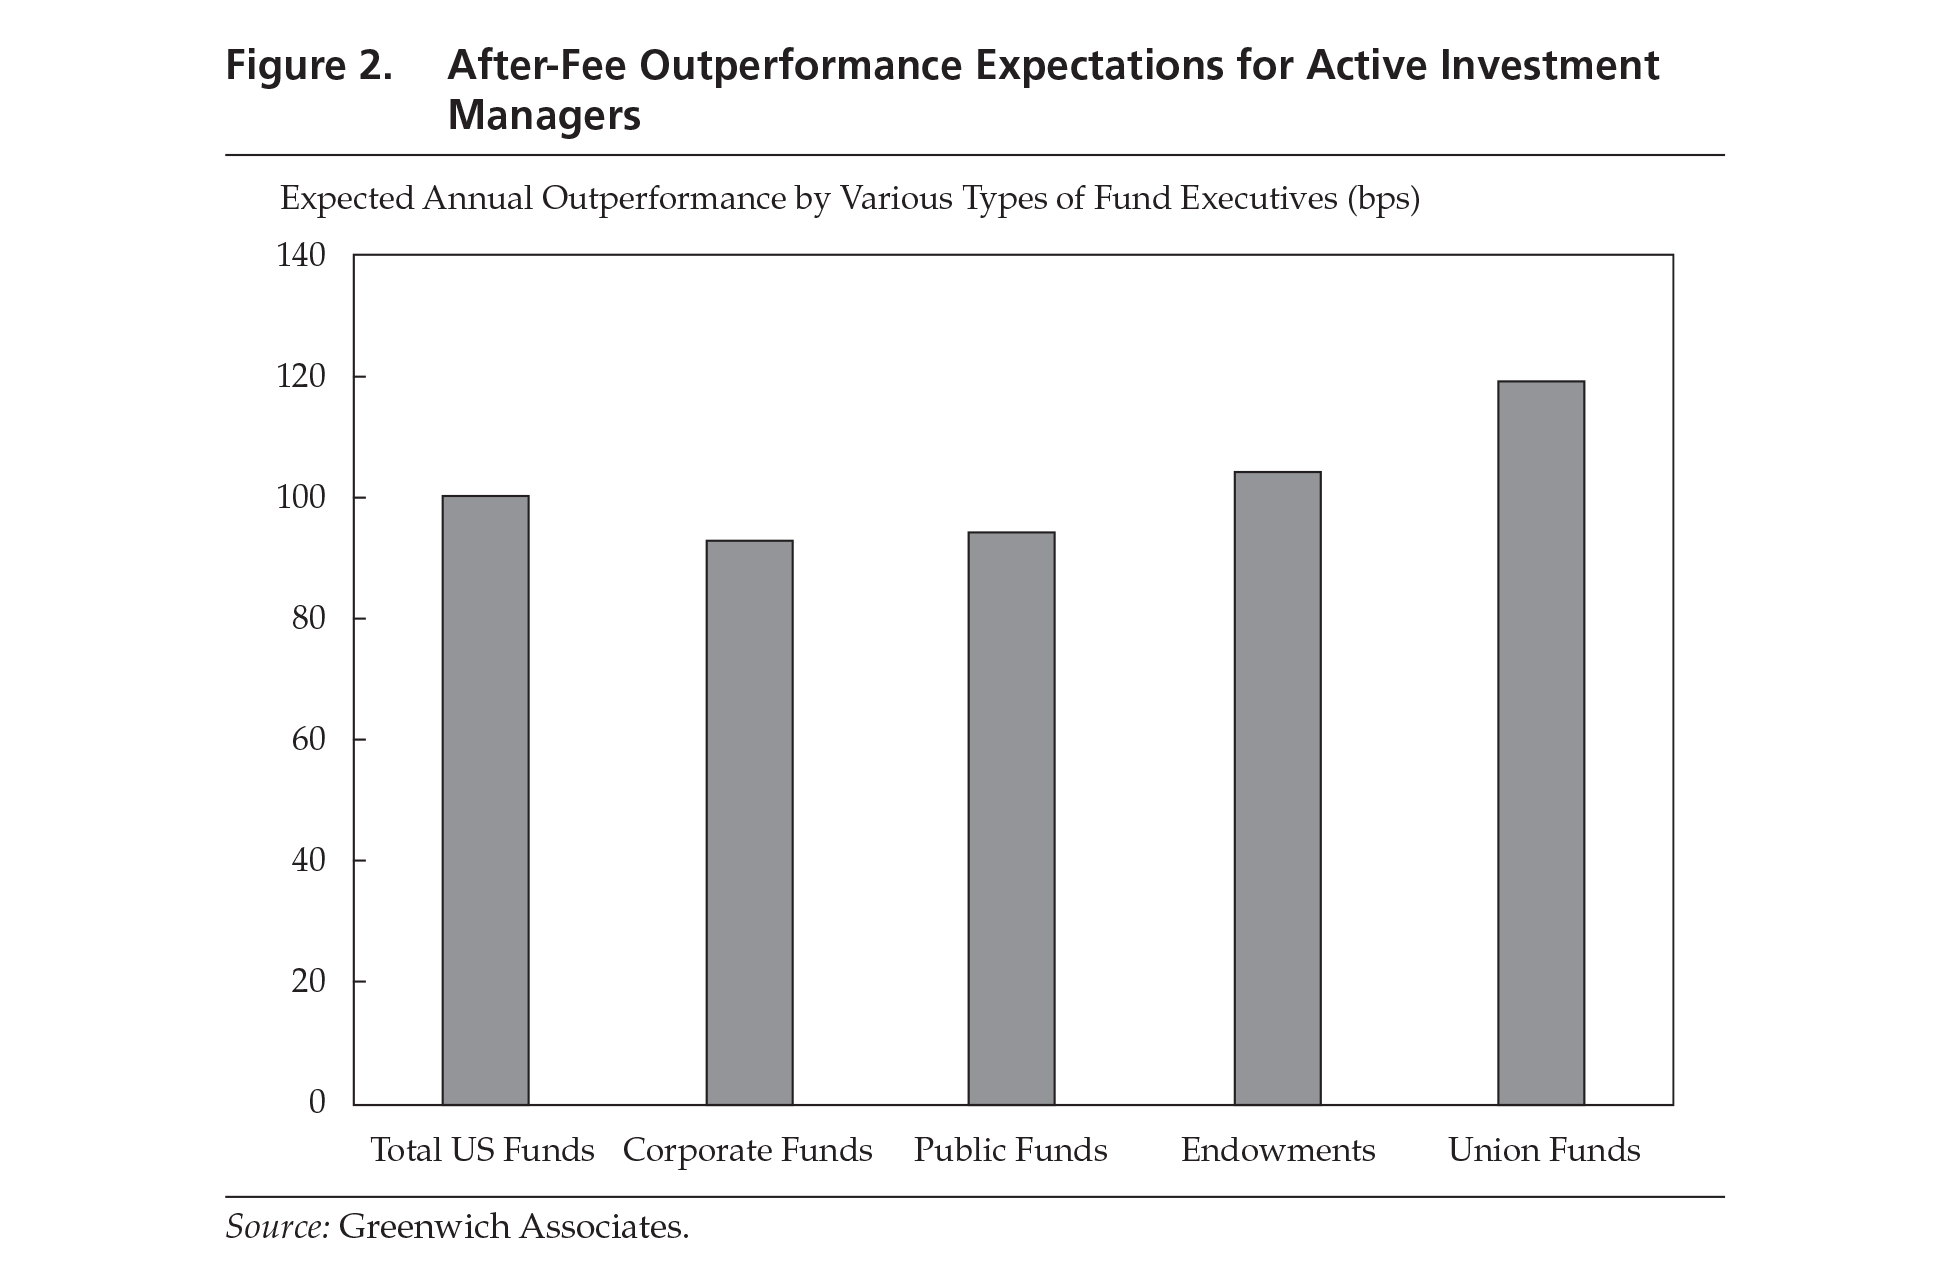
Yet, many clients continue to believe that their managers can and will outperform. (The triumph of hope over experience is clearly not confined to repetitive matrimony.) Even though no major manager has done so, the average US institutional client somehow expects its chosen group of active investment managers to outperform annually, after fees, by a cool 100 bps. As Figure 2 shows, corporate and public pension funds are only slightly less optimistic, whereas endowments and unions are somewhat more optimistic. Among pension fund executives, the elusive magic of outperformance is now the most favored way to close funding gaps.
In 2012, Eugene Fama summarized his study of the performance of all domestic mutual funds with at least 10 years of results:14 “Active management in aggregate is a zero-sum game — before costs. . . . After costs, only the top 3% of managers produce a return that indicates they have sufficient skill to just cover their costs, which means that going forward, and despite extraordinary past returns, even the top performers are expected to be only about as good as a low-cost passive index fund. The other 97% can be expected to do worse” (p. 17).
Quantitative observers might point out that only 3% of active managers’ beating their chosen markets is not far from what would be expected in a purely random distribution. But qualitative observers would caution that odds of 97 to 3 are, frankly, terrible — particularly when risking the real money that will be needed by millions of people in retirement or to help finance our society’s most treasured educational, cultural, and philanthropic institutions. The long-term data repeatedly document that investors would benefit by switching from active performance investing to low-cost indexing.15 This rational change, however, has been exceedingly slow to develop, raising the obvious question: Why?
Understanding the Social Acceptance of Innovation
The problem of acceptance that Darwin faced is not confined to biology or science in general; as Thomas Kuhn explained in his classic book, The Structure of Scientific Revolutions,16 it is universal. Those who have succeeded greatly in their fields naturally resist — often quite imaginatively and often quite stubbornly — any disruptive new concept for two main reasons. First, most new hypotheses, when rigorously tested, do not prove out, and so leading members of the establishment are often dismissive of all new ideas. Second, members of the establishment in any field have much to lose in institutional stature, their reputations as experts, and their earning power. They depend on the status quo — their status quo. Thus, they defend against the new. Usually, they are proved right, and so they win. But not always.
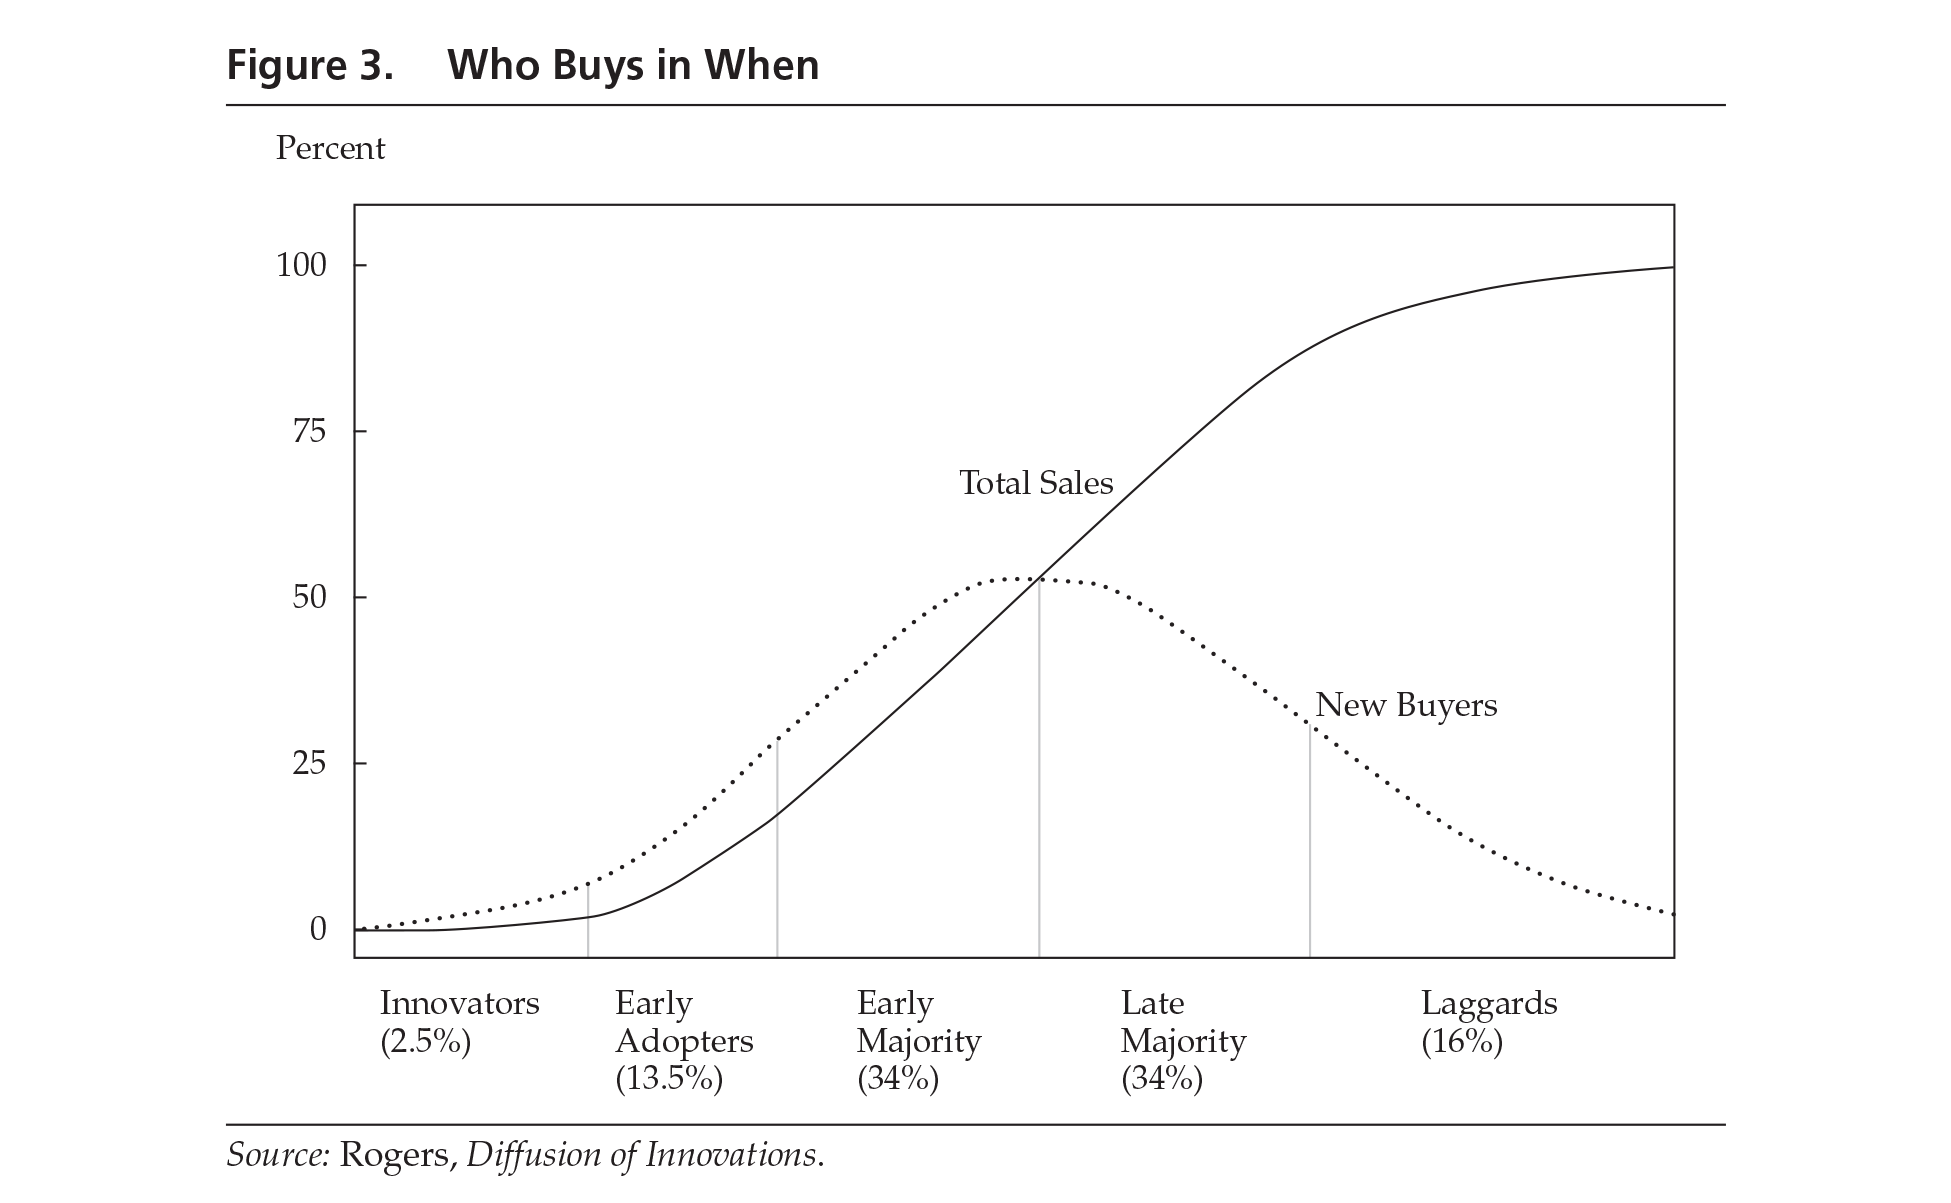
In his scholarly book Diffusion of Innovations,17 Everett M. Rogers established the classic paradigm by which innovations reach a “tipping point” and then spread exponentially through a social system, as shown in Figure 3.
Most members of a social system rely on observing the decisions of others when making their own decisions and repeatedly follow a five-step process:
- Becoming aware of the innovation
- Forming a favorable opinion of the innovation
- Deciding whether to adopt the innovation
- Adopting the innovation
- Evaluating the results of the innovation
Deciding to act or not to act (the third step) depends on confidence in the benefits, compatibility with past habits and norms, and anticipation of how others will perceive the decision — particularly, whether they will approve.
Successful innovations steadily overcome resistance and gain acceptance through a process that is remarkably consistent, but the pace of change differs markedly from one innovation to another. For example, conversion to hybrid seed took a majority of corn farmers 10 years, whereas a majority of doctors adopted penicillin in less than 10 months. The speed with which new and better ways of doing things are adopted is a function of several contributing demand factors: how large and how undeniable the benefits are, the speed with which benefits become visible, the ease and low cost of reversing a mistake, and the quality of the networks by which information and social influences are communicated and expressed.18 Resistance to change is a function of the uncertainty about the benefits of the innovation, the risk of economic loss or social disapproval the new adopter might experience, the risk tolerance of the prospective adopter, and the speed with which rewards and benefits will be known.
Combining Kuhn’s and Rogers’s theories on innovation provides a way to understand the increasing acceptance of performance investing in the 1960s and 1970s, its maturity in the 1980s and 1990s, and the gradual decline in demand for it and the slow but accelerating shift to indexing. Demand for indexing has been retarded by several factors that still encourage investors to stay with active management: the human desire to do better by trying harder; the “yes, you can” encouragement of fund managers, investment consultants, and other participants who make their living as advocates of “doing better”; and investment committees’ focus on selecting the one or two “best” managers from a group of preselected “winners” chosen by consultants. Advertising notoriously concentrates on the superior performance of a small and ever-changing minority of managers. Media coverage centers on reporting the latest winners. (If you watch stock market reports on TV, note how much the newscasters sound like sportscasters.)
However, little is said by the insiders about the numbing consistency with which a majority of active managers fall short of the index or how seldom the past years’ winners are winners again in subsequent years. Glossed over, too, is how hard it is to identify future winners when many investment committees and fund executives apparently believe they can somehow beat the odds by switching from manager to manager. Extensive data show that in the years after the decision to change, the recently fired managers typically outperform the newly hired managers. Other than choosing managers with low fees, no method has been found to identify in advance which actively managed funds will beat the market.19
Of course, recognition of the ever-increasing difficulty of outperforming the expert consensus after substantial fees has not come quickly or easily, particularly from the active managers themselves. We cannot reasonably expect them to say, “We, the emperors, have no clothes,” and to give up on performance investing when they are so committed to active management as a career, work so hard to achieve superior performance for clients, and are so admired for continuously striving.
Nobel Laureate Daniel Kahneman, author of Thinking, Fast and Slow,20 described the socializing power of a culture like the one that pervades active investment management: “We know that people can maintain an unshakable faith in any proposition, however absurd, when they are sustained by a community of like-minded believers. Given the competitive culture of the financial community, it is not surprising that large numbers of individuals in that world believe themselves to be among the chosen few who can do what they believe others cannot.” Many puzzling examples of less-than-rational human behavior can be explained by turning to behavioral economics, where studies have shown, with remarkable consistency, that the Pareto principle, or 80/20 rule, applies to most groups of people when asked to rate themselves “above average” or “below average.” As we see ourselves, most of us hail from America’s favorite hometown: Lake Wobegon. Over and over again, about 80% of us rate ourselves “above average” on most virtues — including being good investors or good evaluators of investment managers.21 This finding may be the key to explaining why indexing has not been pursued even more boldly.
Summing Up
The ironic triumph of active performance investors, who are so capable of price discovery, is that they have reduced the opportunity to achieve superior price discovery so much that the money game of outperformance after fees is, for clients, no longer a game worth playing. The obvious central question for our profession — for each individual and each firm in active investment management — is, When will we recognize and accept that our collective skills at price discovery have increased so much that most of us can no longer expect to outperform the expert consensus by enough to cover costs and management fees and offer good risk-adjusted value to our clients? Another central question is, When will our clients decide that continuing to take all the risks and pay all the costs of striving to beat the market with so little success is no longer a good deal for them? These questions are crucial because to continue selling our services after passing that tipping point would clearly raise the kind of ethical questions that separate a proud profession from a crass commercial business.
Ideally, investment management has always been a “two hands clapping” profession: one hand based on skills of price discovery and the other hand based on values discovery. Price discovery is the skillful process of identifying pricing errors not yet recognized by other investors. Values discovery is the process of determining each client’s realistic objectives with respect to various factors — including wealth, income, time horizon, age, obligations and responsibilities, investment knowledge, and personal financial history — and designing the appropriate strategy.
As a business, active investment management has been a booming success for insiders, but truly professional practitioners want both a great business and an admired profession. Sadly, our collective decisions and behavior, far more than most insiders seem to realize, show that in what we do versus what we say, many of us put “great business” far ahead of “admired profession.” Part of the reason we have been able to put business first is that most clients do not seem to realize what is really going on, and part of the reason is that we insiders do not see, or pretend not to see, our emerging reality all that clearly either.
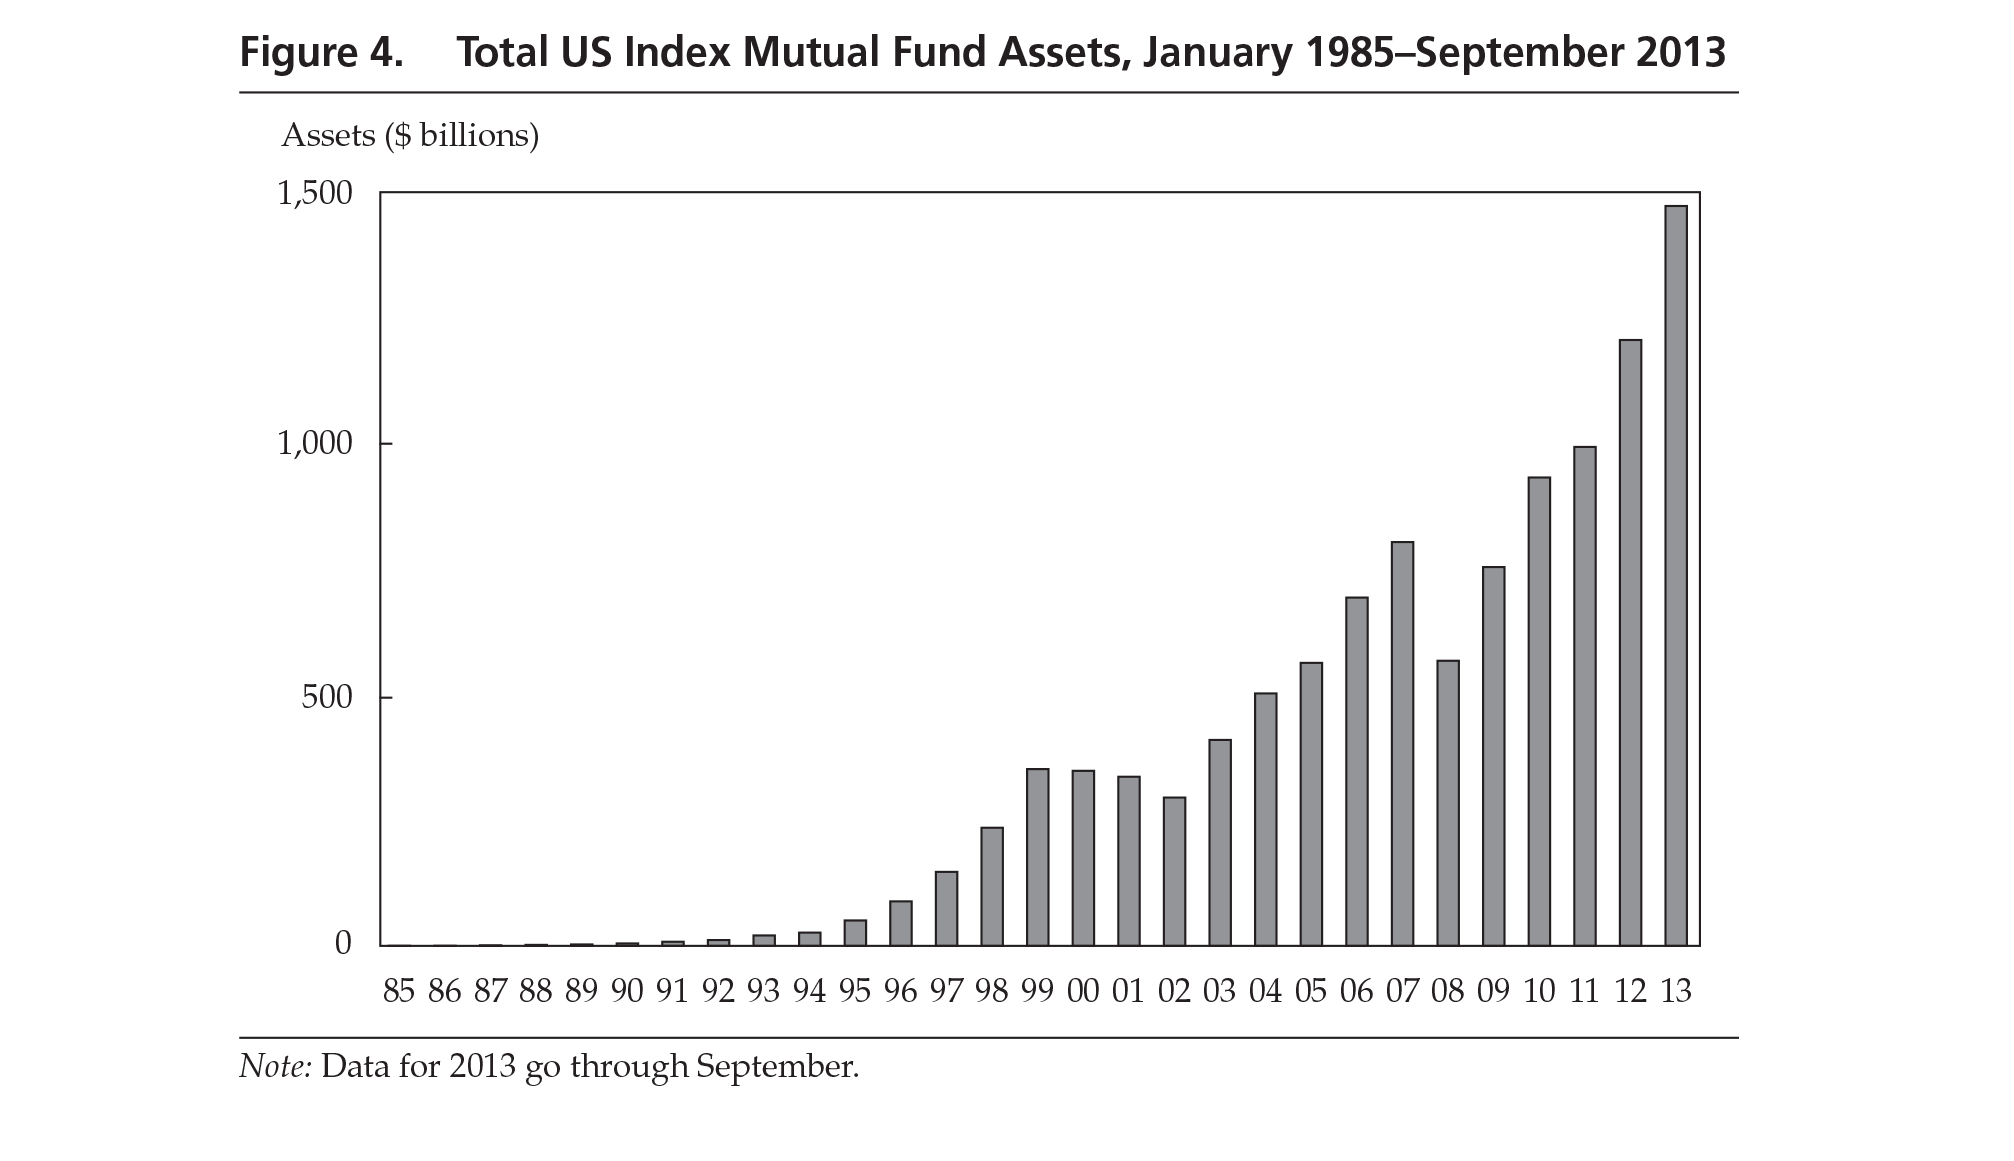
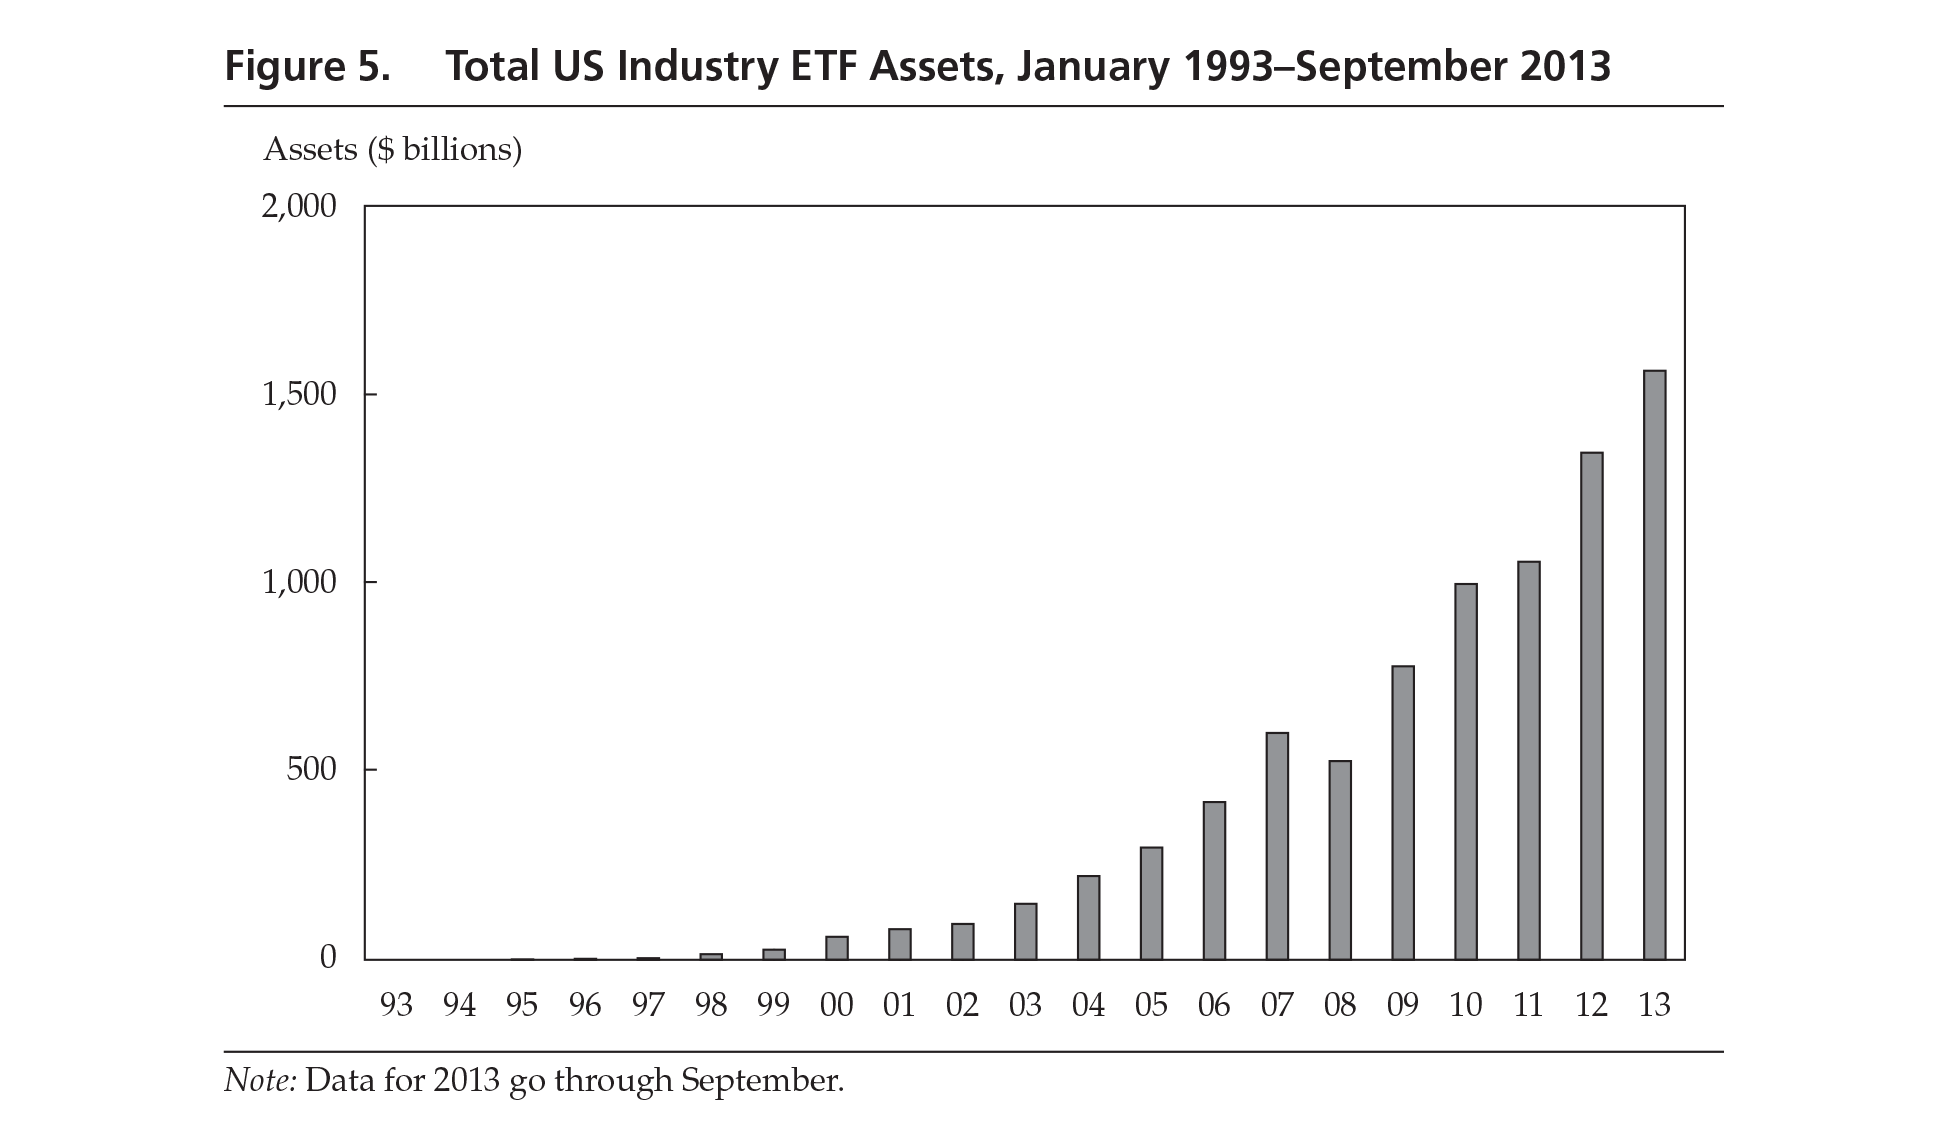
One way to test our thinking would be to ask the question in reverse: If your index manager reliably delivered the full market return with no more than market risk for a fee of just 5 bps, would you be willing to switch to active performance managers who charge exponentially more and produce unpredictably varying results, falling short of their chosen benchmarks nearly twice as often as they outperform — and when they fall short, losing 50% more than they gain when they outperform? The question answers itself. And that is the question each client should be asking — and more and more apparently are asking — before shifting, however warily, to ETFs and index funds. Demand for indexing (Figure 4) and ETFs (Figure 5) is accelerating.
Not all “indexing” is buy-and-hold, passive investing. First, all dealers make active use of ETFs in hedging their positions. Second, part of the total activity is active asset allocation, reminiscent of “market timing” in the 1960s and 1970s — probably with comparably dour results.
Conclusion: Looking Forward
The double whammy of fee compression for active investing and an increasing shift into low-cost indexing will surely depress both the economics of the investment business and the income of individual practitioners. Fortunately, we still have an opportunity to rebalance what we offer clients by re-emphasizing the once-central part of our “twohanded” profession: values discovery, by which every client can be guided through the important questions to an appropriate investment strategy and helped to stay on course through the inevitable market highs and lows.
The “winner’s game” of rigorous, individualized values discovery and counseling may not be as financially rewarding to investment managers as the performance “product” business based on price discovery, but as a profession, it would be far more fulfilling. It is an admirable way forward that would inspire client loyalty — with all the attendant long-term economic benefits — and would provide practitioners with deep professional satisfaction. Although not as exciting as competing on price discovery, investment counseling based on values discovery is greatly needed by most investors — institutional investment committees as well as individual investors — and surely offers more opportunities for real long-term success to both our profession and our clients.
Notes
- Facebook and Twitter were recently approved as vehicles for fair disclosure.
- Antti Petajisto showed how active management can be successful, at least for a time, in “Active Share and Mutual Fund Performance,” Financial Analysts Journal, vol. 69, no. 4 (July/ August 2013):73–93. In 2009, Petajisto and Martijn Cremers reported on similar work in “How Active Is Your Fund Manager? A New Measure That Predicts Performance,” Review of Financial Studies, vol. 22, no. 9 (September 2009):3329–3365. In 2010, Randolph Cohen, Christopher Polk, and Bernhard Silli reported that very large active positions can outperform the market (see “Best Ideas,” working paper [15 March 2010]). In 2011, Robert Jones and Russ Wermers discussed various strategies that active managers could pursue in “Active Management in Mostly Efficient Markets,” Financial Analysts Journal, vol. 67, no. 6 (November/December 2011):29–45. Studies naturally differ. Assertions of market efficiency tend to provoke argumentative references to investors with extraordinary long-term records. In recent years, the most commonly cited outlier has been Warren Buffett, whose Berkshire Hathaway shares have risen from about $15 to over $170,000 since he gained control, in 1965, and have a higher Sharpe ratio than any other stock or mutual fund with a history of more than 30 years. No one doubts that Buffett is an extraordinary investor. However, in “Buffett’s Alpha,” a widely noted 2013 study (NBER Working Paper 19681), Andrea Frazzini, David Kabiller, and Lasse H. Pedersen concluded, “We find that [Berkshire’s] alpha become[s] statistically insignificant when controlling for exposures to Betting-Against-Beta and quality factors. …Berkshire’s returns can thus largely be explained by the use of leverage [low- or no-cost float from the company’s insurance operations] combined with a focus on cheap, safe, quality stocks.”
- Darwin’s ability to recognize evolution in the various finches of the Galapagos Islands came in part from his geologist friends’ study of mountains. As he had learned from them, even gigantic rock mountains move and change over time—observably if the time frame for consideration is long enough. Similarly, the key to understanding the profound forces for change in active investing, particularly in the results produced for investors, is to study major trends over the long term.
- Symbolic of that bygone era, the only investment management course at Harvard Business School in the early 1960s had a boring professor and an embarrassingly small number of students, who were there because they were assured a good grade for showing up. They had to be willing to wade through the dull details of a local bank trust officer’s dealings with the tedious administrative minutiae of the account of Miss Hilda Heald, an inattentive elderly widow. Because the course met from 11:30 a.m. to 1:00 p.m., it suffered the obvious, pejorative nickname “Darkness at Noon.”
- Despite considerable time and effort and access to managers’ data, the self-chosen task of the investment consultant firms has proved far more difficult than expected. As a group, selection consultants have caused their clients to underperform by 1.1% of assets, according to Tim Jenkinson, Howard Jones, and Jose Martinez, “Picking Winners? Investment Consultants’ Recommendations of Fund Managers,” working paper (Saïd Business School, 11 December 2013). That consultants were unable to identify winning firms consistently cannot be entirely surprising. Of course, they do deliver other kinds of value to their clients: data on the performance of clients’ managers versus that of many other managers; advice on asset mix, rate of return assumptions, spending rules, and new investment ideas; and a steadying influence when temptations to take action are strongest at market highs and lows.
- Doubting they could charge much in fees and interested in protecting their important corporate banking relationships, banks found a novel backdoor way to make money as pension fund investment managers. They directed their trust departments’ commission business to brokers who agreed to keep large balances on deposit, balances that the banks could profitably lend out. The terms of reciprocity — typically, $5 in commissions for every $100 of balances — were closely monitored by both sides.
- Ajay Khorona, Henri Servaes, and Peter Tufano, “Mutual Funds Fees around the World,” HBS Finance Working Paper 901023 (2007).
- Among mutual funds, fees vary significantly from fund to fund and by type of fund—even between comparable index funds. A study of 46,799 funds in 18 countries found some mutual fund total annual expense ratios to be significantly higher than 1% of assets: Australia, 1.60%; Canada, 2.68%; France, 1.13%; Germany, 1.22%; Switzerland, 1.42%; United Kingdom, 1.32%; United States, 1.42%. In addition to expense ratios, another charge of (typically) 25 bps is often levied as a 12b-1 fee, or “distribution fee.” These fees are either paid directly to brokers for “shelf space” or used for advertising and other marketing expenses. Another fee or “load” is often deducted from the mutual fund investor’s assets at the date of purchase. Load funds have lost share of assets in recent years. From 2001 to 2011, load funds increased assets by only $500 billion whereas no-load fund assets increased by over $3 trillion.
- Active management fees of 30 bps for institutions are an incremental 25 bps higher than institutional index fund fees of 5 bps or less. That 25 bp higher cost is the correct incremental fee to compare with incremental returns. Over the long run, few if any active managers outperform by 25 bps.
- The impact of “only 1%” can accumulate over time into a very large number. In one example, two investors each start with $100,000 and add $14,000 each year for 25 years. One of the investors selects a manager who charges 1.25%, whereas the other investor pays only 0.25% — a difference of “only 1%.” After 25 years, both have more than $1 million, but the difference between them is $255,423: Over a quarter-million dollars separates $1,400,666 from $1,145,243.
- Stephen Gould described the “paradox of risk”: As people become more skilled, luck ironically becomes more important in determining outcomes because although absolute skill rises, relative skills decline.
- Vanguard’s 2011 report continued: “Taking this analysis to its logical next step, one might rightly assume that funds that fall to the bottom quintile might be the next to fall into the liquidated/merged bin. Indeed, when we [studied] funds that fell into the bottom quintile as of December 31, 2006, we found that fully 50% were liquidated or closed by year-end 2011, and that 10% remained in the bottom quintile, while only 21% managed to right the ship and rebound to either of the top two quintiles.”
- For international developed- and emerging-market managers, failure to match or exceed benchmarks has been 85% and 86%, respectively. For bond managers, failure rates have averaged 78% (including 93% for high-yield bonds and 86% for mortgage bonds).
- Robert Litterman interviewed Fama at the 65th CFA Institute Annual Conference in Chicago in May 2012, and the interview was published as “An Experienced View on Markets and Investing,” by Eugene F. Fama and Robert Litterman, Financial Analysts Journal, vol. 68, no. 6 (November/December 2012):15–19. Given the noise in the data on managers’ investment performance records, Fama concluded that “an investor doesn’t have a prayer of picking a manager that can deliver true alpha. Even over a 20-year period, the past performance of an actively managed fund has a ton of random noise that makes it difficult, if not impossible, to distinguish luck from skill” (p. 17).
- An intriguing question: What if all investors indexed? Because that is unlikely, ask instead, At what level of indexing would price discovery — which serves important societal purposes — become sufficiently imperfect that active management would once again be successful? Assuming that NYSE daily turnover continues at over 100% of listed shares and index funds average 5% annual turnover, if indexing rose to represent 50% of total equity assets (from about 10% today), the trading activities of index funds would involve less than 3% of total trading. Even if 80% of assets were indexed, indexing would represent less than 5% of total trading. It is hard to believe that even this large hypothetical change would make a substantial difference to the price discovery success of active managers, who would still be doing well over 90% of trading volume.
- University of Chicago Press (1962).
- Free Press (1962).
- One of the Wall Street Journal’s largest advertisers is an active manager of mutual funds.
- See Charles D. Ellis, “Murder on the Orient Express: The Mystery of Underperformance,” Financial Analysts Journal, vol. 68, no. 4 (July/August 2012):13–19. Morningstar and others have found that the only persistence in performance is that high-fee funds continue to underperform and that low fees are the best indicator of superior future performance.
- Farrar, Straus and Giroux (2011).
- In a recent survey, 87% of respondents also confided that they deserved to go to heaven — well above their estimates for Mother Teresa and Martin Luther King.


 Voices is an occasional column that allows wealth managers to address issues of interest to the advisory community. Mitch Tuchman is cofounder of retirement investment firm Rebalance in Palo Alto, Calif. He offers a counter argument to a previous Voices column about the advantages of active stock picking.